 Deutsch
 English
Actor constellation analysis
Innovations and best practices from TEN.efzn
The interdisciplinary collaboration within the TEN.efzn research network is bearing fruit. From time to time, these results are presented in the form of selected tools, developments, and (interim) findings.
The fact that these need not be exclusively “traditional” transfer products—such as startups or market-ready technologies in the context of the energy transition—is already evident from the first artifact: a functional tool for actor constellation analysis.
It was developed by the research platform “Trustworthy digitalization of safety-critical energy systems” as part of a joint research effort with social scientists from the research platform “Social dynamics of energy transformation”—and was very well received by numerous researchers when it was presented at the TEN.efzn annual conference in December 2025.


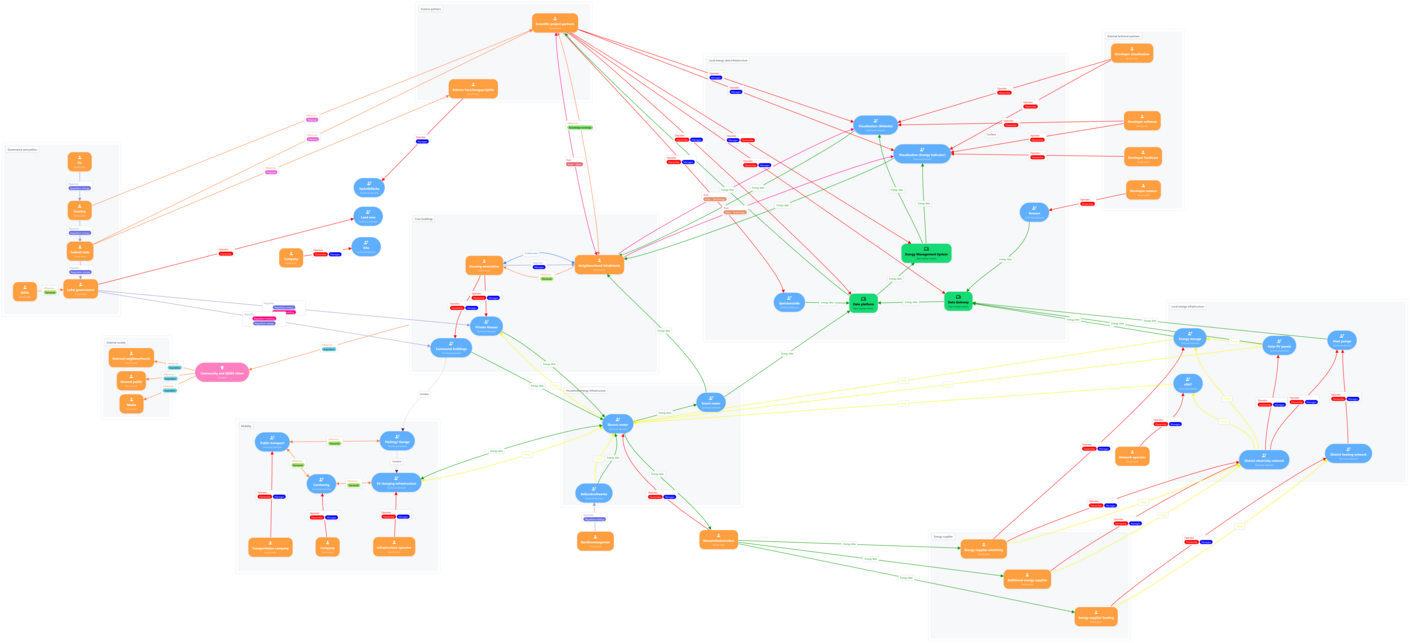
Actor-constellation analysis is a method already established in academic contexts that can be used to capture, analyze, and visualize complex relationships between various human and non-human actors, technologies, natural elements, and framework conditions in innovation or sustainability processes.
Here’s an example to clarify this: Behind the contract a person signs with a provider for the supply of electricity, there are actually a whole host of other actors involved: For instance, the electricity meter—for which a base fee is charged—may come from a different actor than the chosen electricity provider. Consequently, anyone who rents rather than owns their home is also not the owner of their heating system. If there is a PV system on the roof of the rental property, this is likely accompanied by a self-supply offer from the landlord to the tenant—who then obtains part of their electricity from their landlord and another part from a different provider.
In this seemingly very small area alone, there are already several parties involved who are in contractual relationships, influence one another, and exchange data. Things become far more complicated when the topic of sector coupling is added to the mix: then, for example, operators of charging stations, car-sharing services, grid operators, etc., are also involved.
However, stakeholder constellation analysis not only provides insights into existing relationships, power dynamics, and interdependencies among stakeholders—such as in energy districts—but also allows for the identification of potential barriers to the implementation of new factors, such as a lack of trust in certain stakeholders.
Clearly display and filter extensive networks of relationships
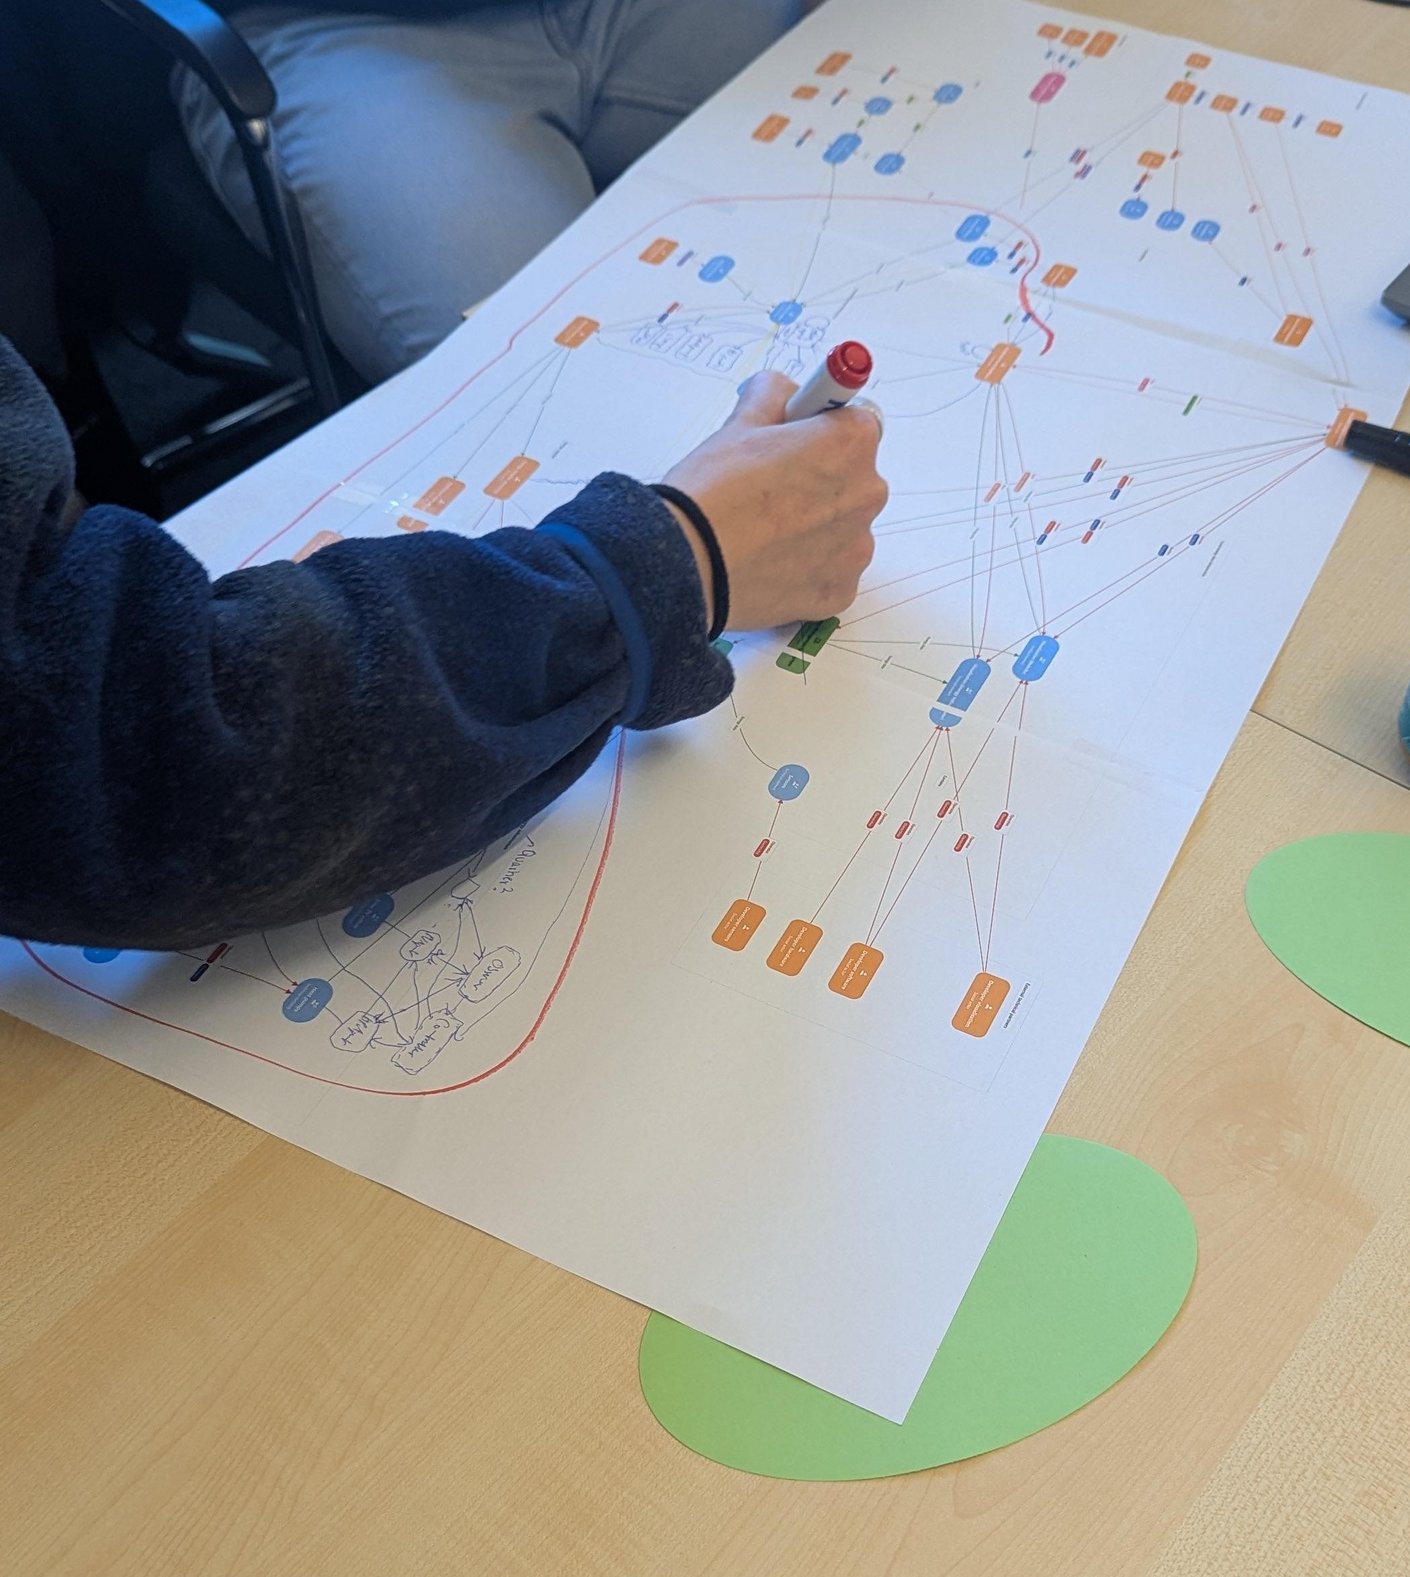
The more extensive and complex the relationship networks under consideration are, the more important it is to be able to illustrate them as clearly as possible—especially with a view to sharing this analysis productively with colleagues from other departments. To this end, the new tool, the “Constellation Analyzer,” an interactive website, offers extensive and customizable options for data analysis and visualization.
There are no “standard maps”: actors, types of relationships, and dependencies between them—such as existing contracts or the exchange of data between different technical systems—are precisely created and linked by the researchers. The finished visualization can be exported as an image or as a vector graphic. In addition, it can be downloaded back to the computer as an editable document for further editing.
To search specifically for connections and categories within the analysis of a particular constellation of actors, a filter function has been built in that allows users to display, at the click of a button, exactly the area they wish to examine more closely.
Whether it involves existing power dynamics among actors, the impact of specific legislative changes on technology regulation, or the related question of where legislation originates— Whether it’s the exchange and management of data, types of financial flows, or the ownership structure of facilities in the energy district under consideration—all of this can be presented in a structured and clear manner.
Reference database ensures transparency regarding the origin of the data
And because transparency is an essential principle of good scientific practice—that is, documenting the origin of the data and materials used in a traceable manner and according to specific standards—the tool also includes a literature reference database. This allows researchers to enter their sources, including both empirical material from interviews and workshops and existing scientific literature.
For example, if information about relationships between individual actors in an actor constellation analysis comes from an interview with residents, the corresponding citation—which serves as the basis for the analysis—can be entered into the literature reference database. If the information refers to a website or a publication, it can also be transparently noted there—and can later be exported and used for the preparation of one’s own academic papers.
Visualizing and comparing changes in the network of actors
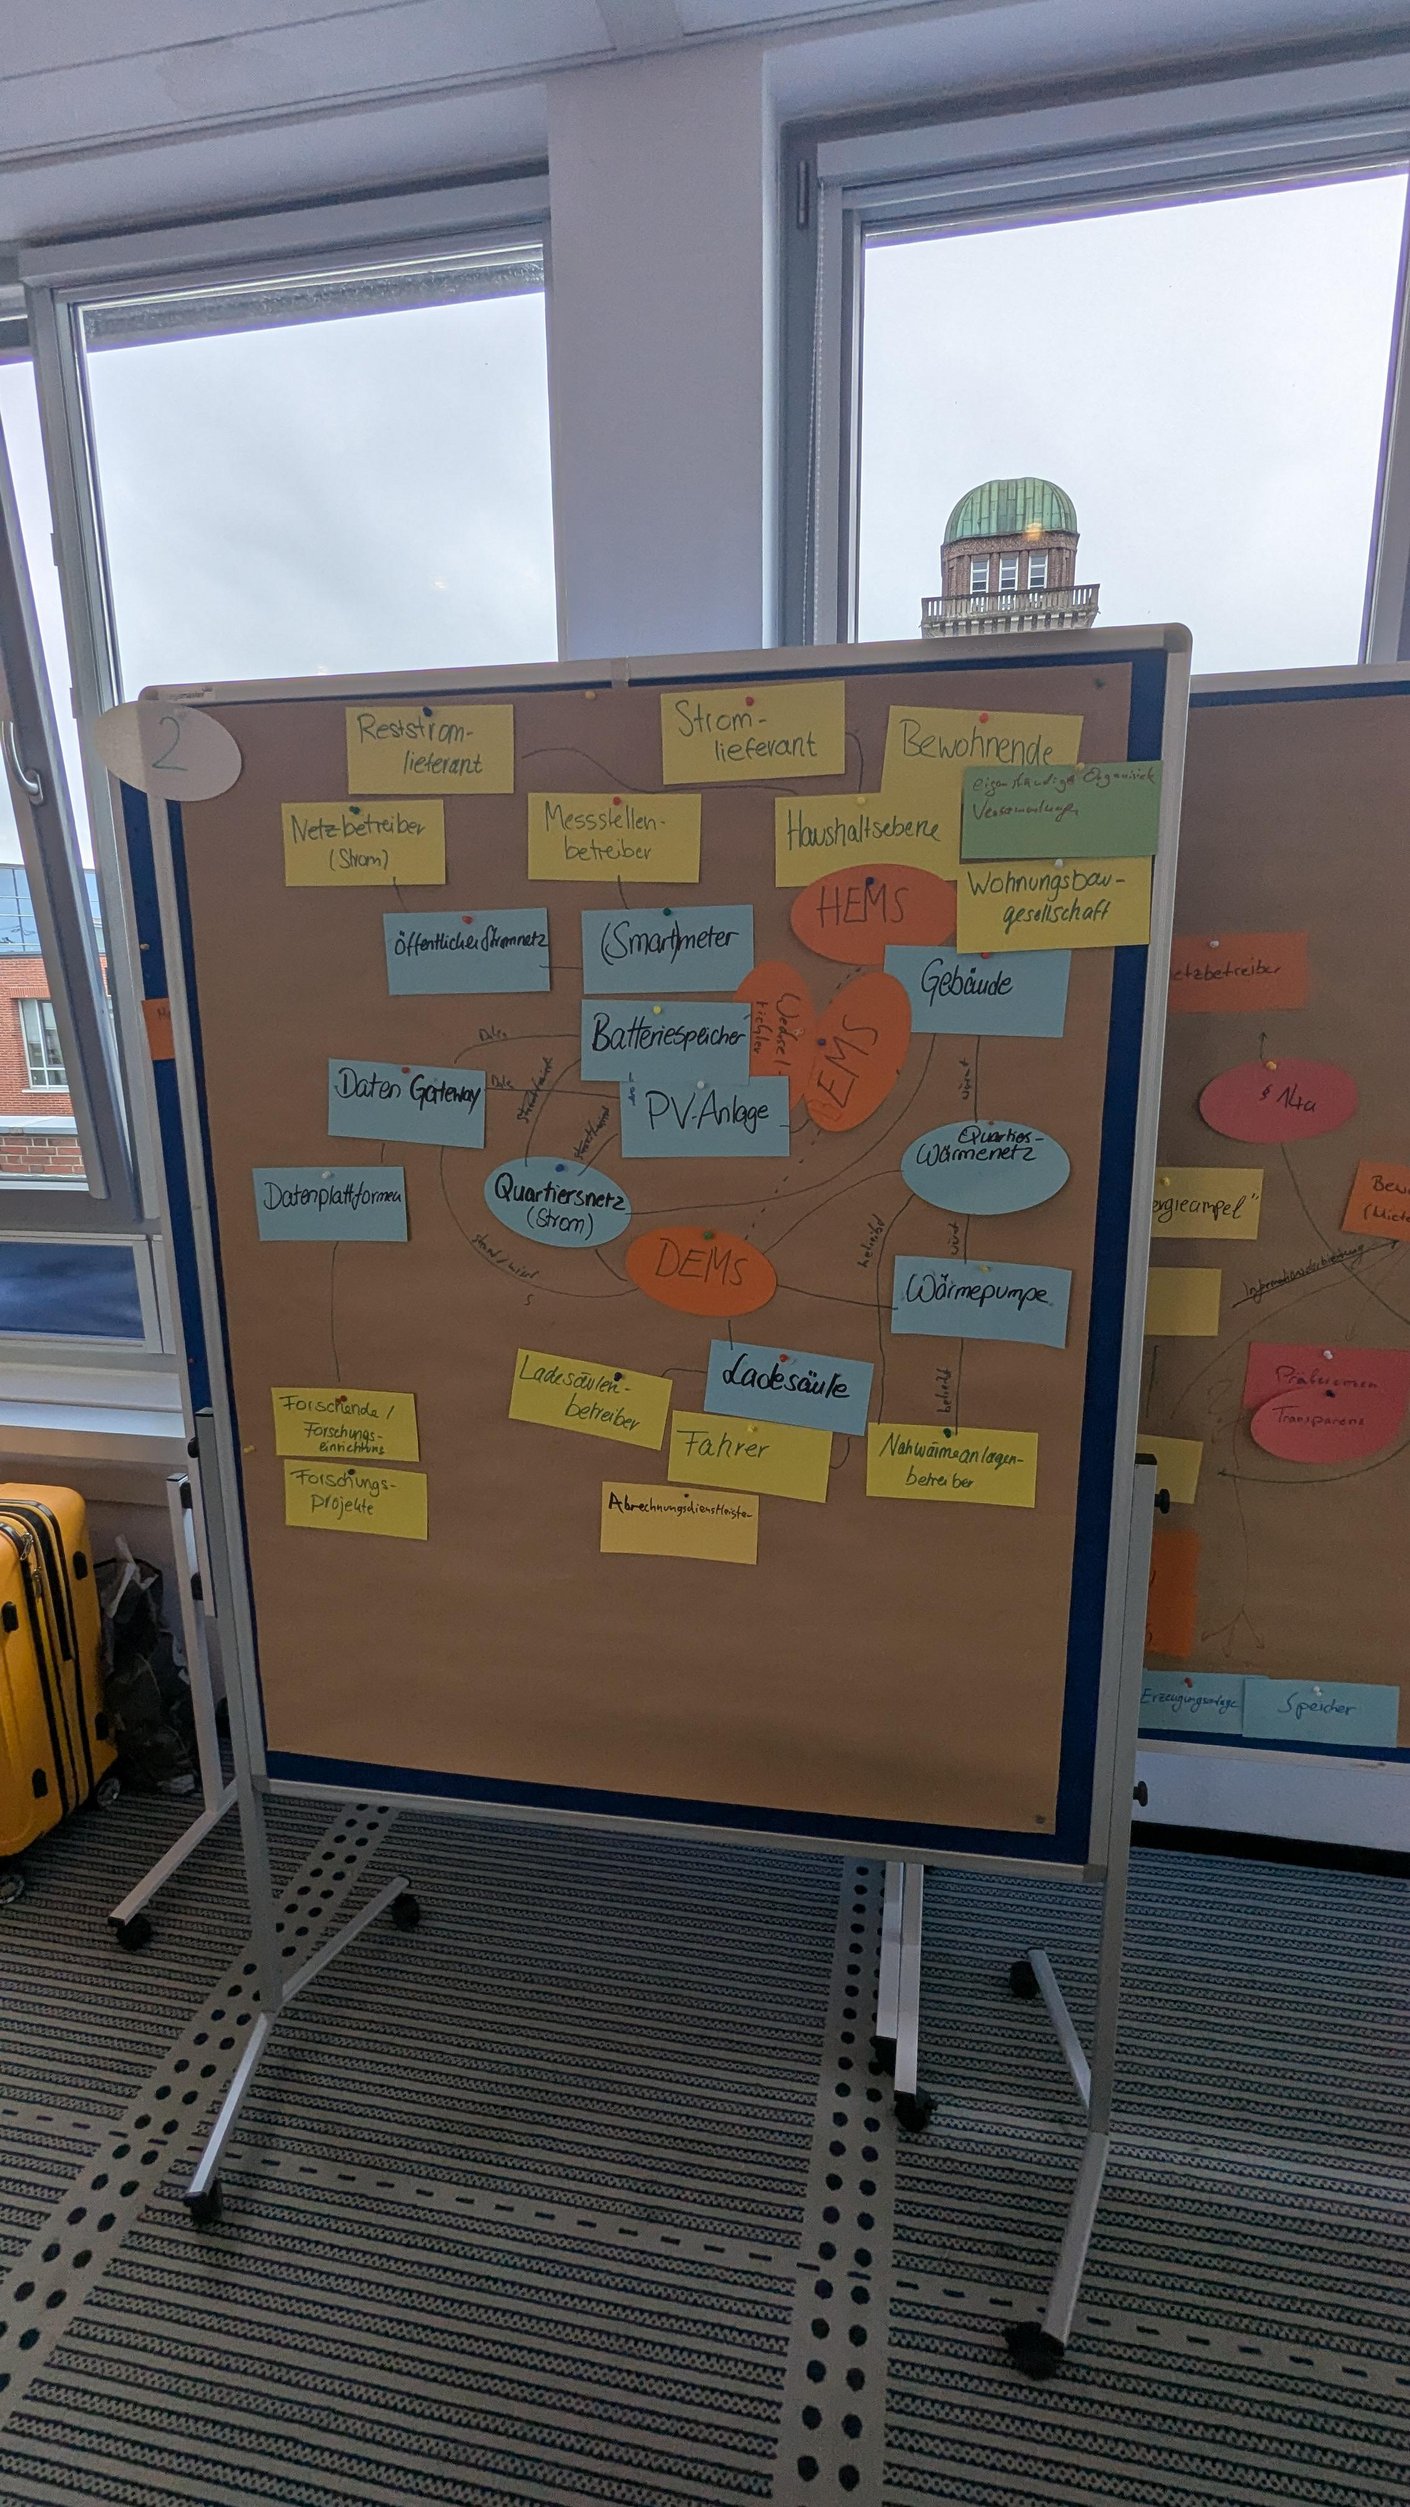
Because stakeholder constellations can certainly change over the course of a project—that is, new factors and stakeholders may emerge—it was important to the developers to take this temporal dimension into account and explicitly incorporate it into the tool. To this end, different stakeholder constellations can be created at various points in time and compared with one another.
An example of a possible change would be the following: In July 2026, a new regulation takes effect that enables energy sharing among private individuals. From then on, solar power can be shared and sold among neighbors. A household can then sell surplus PV electricity to one or more neighboring households without having to take on the full responsibility of supplying its neighbors.
Any additional electricity needed—for example, during nighttime hours—will then be obtained by the neighbors from a so-called residual electricity supplier, a new actor that complements the existing landscape of actors and makes the prevailing relationships even more complex; in turn, other interdependencies may become obsolete.
To model such changes, stakeholder analyses created in this tool—which, incidentally, was deliberately designed as open source—can be duplicated and updated to reflect changes that have occurred up to the time of a new survey. This allows users to visualize changes over time as well as draw comparisons between the various survey dates.
An ideal tool for preserving knowledge—but not a set-and-forget solution
However, anyone hoping to simply upload a dataset and have the tool automatically generate the relationships between actors will not be able to do so. Furthermore, there are currently no functions for automatic evaluation. Operating the tool and analyzing the data must be done independently and manually.
This work forms the foundation for gaining the most accurate insights possible into the development of a specific technology or the transformation process of an energy district. Through detailed structuring and the resulting visualization, researchers can make their knowledge and findings more transparent and visible.
It is precisely the interdisciplinary exchange, the linking of diverse sources and empirical material with one another, as well as continuous reflection on the defined relationships and actors within the constellation under consideration, enable researchers to transform data from a snapshot and a list of actors into an analysis of the constellation of actors that can do justice to the complex, dynamic, and time-varying nature of a transformation process.
Even though, according to Florian Helfrich, a project staff member at the Institute for Social Sciences at the University of Oldenburg, it is already an optimal tool for analyzing, storing, and transferring the data collected by researchers—the developers are continuously working to improve it.
For example, due to the size and complexity of the visualizations, it is not yet possible to directly link different surveys from various research platforms across different projects without first processing the data. This feature is planned for the tool’s future development but, as things stand, is still some way off, says Dr.-Ing. Sven Rosinger, coordinator of the Digitalization Research Platform.
Challenge: incorporating and representing the aspect of trust in the analysis
The effort to incorporate the topic of trust in energy infrastructures—including their development and digitalization—into the actor constellation analysis of the Helleheide real-world lab is also a challenge that will persist throughout the entire duration of the research project.
Rosinger states that the goal is definitely to engage in continuous reflection and examination of the role that trust plays in the context of energy infrastructures. This is because TEN.efzn builds on a predecessor project in this very Reallabor and, with the help of the tool, establishes a connection and continues the work. Central to this is the addition of the dimension of trust—an aspect that is still often under-researched in this context, but whose implications promise to have a significant impact even beyond the scope of this specific project.
Finally, the analysis of indirect trust relationships appears particularly intriguing: if a person trusts their neighbor, and that neighbor in turn trusts a company, the question arises as to whether this indirectly results in trust in that company—for example, regarding the provision and operation of energy infrastructure such as PV systems, heat pumps, or energy storage systems.
According to Rosinger, the complexity of implementing the concept of trust into the Actor Constellation Analysis tool stems from the fact that this trust cannot simply be quantified and mapped. However, the researchers are eager to take on the challenge of finding a viable way to map it.
The visualization shows: “All actors in the project are working toward the same goal”
Building on initial actor analyses and preliminary work, the tool has evolved from a representation of various actors into an interdisciplinary research tool that is now actively used and further developed with the results of collaborative work within the research platform.
It is now possible to map the various research interests and studies within the visualization and further elucidate their interconnections. It can now be clearly visualized that all researchers and their partners in the research platform are working on a single, large-scale use case.
“It’s nice to bring them all together on a map,” says the research platform coordinator: “Even though it may feel like everyone is working in isolation from one another, they are all contributing to the same goal—the same use case—and are interconnected.”
Anyone who’s interested can thoroughly test and use the “Constellation Analyzer,” which has been developed as a freely available online tool.
It can be accessed at https://offis-esc.github.io/constellation-analyzer/ and via the QR code shown here.
The tool’s developers are now very eager to receive external feedback:
“As part of the TEN.efzn research program, we are constantly refining the tool. Additional versions, along with user guides, teaching materials, a dedicated website for the tool, and sample use cases for your own analyses are planned and will be published in future posts.
As a freely available online tool, you can test it yourself and visualize and analyze any complex network of actors. Use the tool for your analyses and to facilitate accessible knowledge transfer. We’re eager to hear about your use cases and would love for you to share your experiences with us!”
You can do so by emailing Sven Rosinger at sven.rosinger@offis.de or Florian Helfrich at florian.helfrich@uni-oldenburg.de.
DOI and citation:
Bruhn, J.-H., Helfrich, F., Kerker, N., & Rosinger, S. (2026). Constellation Analyzer (Version v1.1.1) [Computer software]. Zenodo. https://doi.org/10.5281/zenodo.22659218